


The Office of the Controller of Examinations, National Examination Board (NEB), officially published the Secondary Education Examination (SEE) results for the academic year 2082 on Baisakh 28, 2083 (May 11, 2026). The exams were held from Chaitra 19 to Chaitra 29, 2082.
Students who appeared for the SEE 2082 examination can now check their results online through the official portal: see.edusanjal.com.
This year’s result publication is notably faster than last year. The SEE 2081 results were published on Asar 13, 2082 (June 27, 2025), nearly three months after the examinations. In contrast, the 2082 results were released within approximately one month of the exam’s completion, fulfilling the government’s directive for timely result declaration.
This timely release has generated significant interest among students, parents, teachers, and education stakeholders, as it provides an early opportunity to assess the performance trends across the country. The following section offers a factual and detailed comparison of student performance between the academic years 2082 and 2081, focusing on GPA distribution, total graded students, and NG (Not Graded) statistics.
Overall Statistics
| Metric | 2082 | 2081 | Difference |
|---|---|---|---|
| Total Students | 430,667 | 438,896 | -8,229 |
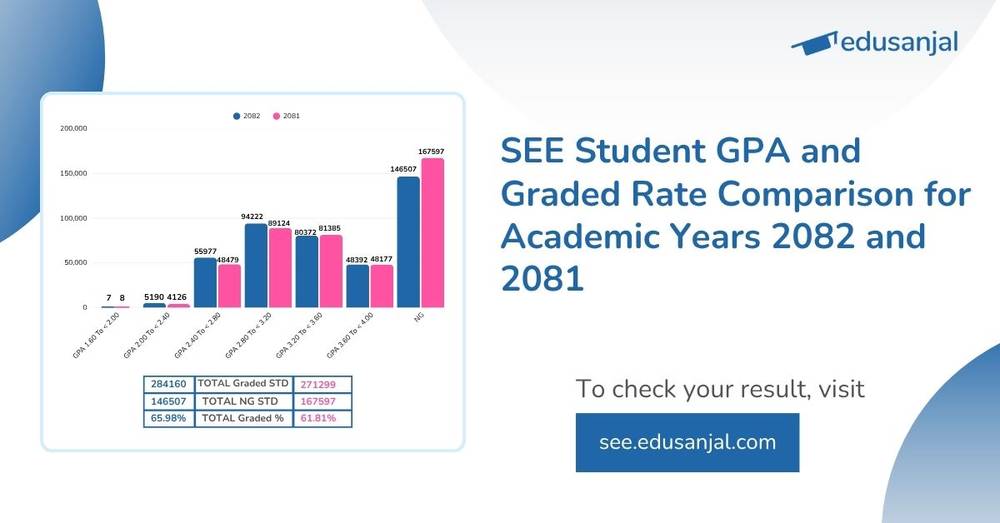
| Total Graded Students | 284,160 | 271,299 | +12,861 |
| Total NG Students | 146,507 | 167,597 | -21,090 |
| Graded Percentage | 65.98% | 61.81% | +4.17 percentage points |
GPA Distribution Comparison
| GPA Range | 2082 | 2081 | Difference |
|---|---|---|---|
| 1.60 to < 2.00 | 7 | 8 | -1 |
| 2.00 to < 2.40 | 5,190 | 4,126 | +1,064 |
| 2.40 to < 2.80 | 55,977 | 48,479 | +7,498 |
| 2.80 to < 3.20 | 94,222 | 89,124 | +5,098 |
| 3.20 to < 3.60 | 80,372 | 81,385 | -1,013 |
| 3.60 to ≤ 4.00 | 48,392 | 48,177 | +215 |
| 4.00 | 1,595 | 971 | 624 |
| NG (Not Graded) | 146,507 | 167,597 | -21,090 |
Key Observations
- Total student participation slightly decreased from 438,896 in 2081 to 430,667 in 2082.
- The number of graded students increased by 12,861.
- The NG category recorded the largest reduction of 21,090 students.
- The 2.40 to < 2.80 GPA range saw the highest growth with an additional 7,498 students.
- The 2.80 to < 3.20 GPA range remained the largest category in both years.
- The highest GPA bracket (3.60 and above) showed only a marginal increase of 215 students.
- A total of 1,595 students achieved 4.0 GPA, compared to 971 students last year.
Conclusion
The SEE 2082 results demonstrate an overall improvement in grading outcomes compared to 2081. The graded percentage increased by 4.17 percentage points, and the substantial reduction in NG students indicates better overall student participation and evaluation outcomes.
While there has been growth in the middle GPA ranges, the number of students achieving the highest GPA bracket (3.60+) has remained nearly stable. The slight decline in total student numbers and the continued presence of over 146,000 NG students highlight areas that may require further attention from education authorities.
This data provides a useful baseline for schools, teachers, and policymakers to identify trends and implement targeted interventions for future academic years.