


The National Examination Board (NEB) officially published the Grade 12 results for the academic year 2083 on Ashadh 05, 2083. The announcement has drawn widespread attention from students, parents, teachers, and education stakeholders across Nepal, eager to assess how this year's performance compares to the previous year.
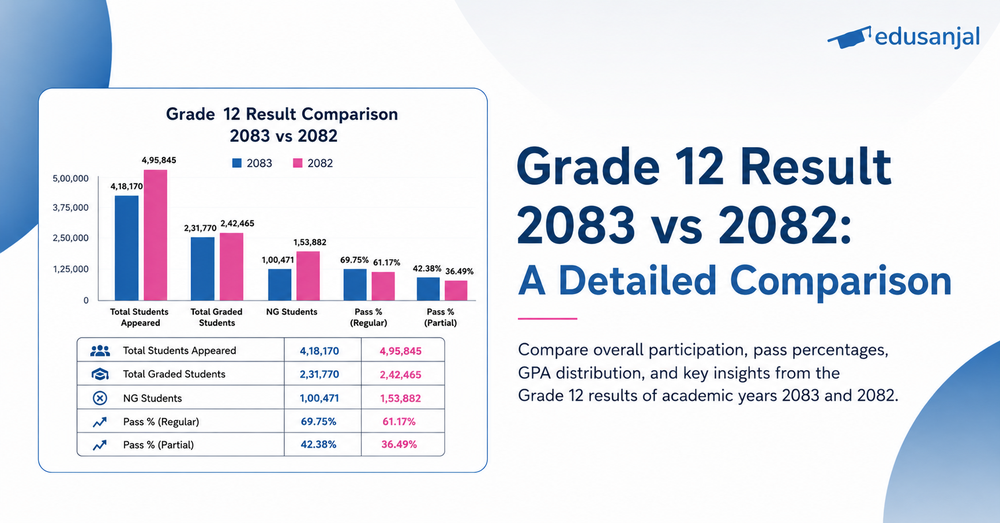
This article presents a factual and detailed comparison of Grade 12 results between the academic years 2083 and 2082, focusing on overall participation, grading outcomes, pass percentages, and GPA distribution.
Overall Statistics
| Metric | 2083 | 2082 | Difference |
|---|---|---|---|
| Total Students Appeared (Regular) | 3,32,241 | 3,96,387 | -64,146 |
| Total Students Appeared (Partial) | 85,929 | 99,458 | -13,529 |
| Total Students Appeared | 4,18,170 | 4,95,845 | -77,675 |
| Students with Canceled Exams | 40 | 17 | +23 |
| Total Graded Students | 2,31,770 | 2,42,465 | -10,695 |
| Total NG Students | 1,00,471 | 1,53,882 | -53,411 |
| Pass Percentage (Regular) | 69.75% | 61.17% | +8.58 |
| Pass Percentage (Partial) | 42.38% | 36.49% | +5.89 |
| Overall Pass Percentage | 64.13% | — | — |
GPA Distribution Comparison
| GPA Range | 2083 | 2082 | Difference |
|---|---|---|---|
| 3.61 to ≤ 4.00 | 17,786 | 13,502 | +4,284 |
| 3.21 to ≤ 3.60 | 64,821 | 55,896 | +8,925 |
| 2.81 to ≤ 3.20 | 94,249 | 94,268 | -19 |
| 2.41 to ≤ 2.80 | 50,597 | 69,812 | -19,215 |
| 2.01 to ≤ 2.40 | 4,308 | 8,964 | -4,656 |
| 1.61 to ≤ 2.00 | 9 | 23 | -14 |
| NG (Not Graded) | 1,00,471 | 1,53,882 | -53,411 |
Key Observations
- Total student participation fell significantly from 4,95,845 in 2082 to 4,18,170 in 2083, a drop of 77,675 students across both regular and partial categories.
- Total graded students also decreased by 10,695, from 2,42,465 to 2,31,770. This decline is directly tied to the large drop in overall participation rather than a worsening of pass rates.
- NG students dropped by 53,411, falling from 1,53,882 to 1,00,471. This is the most positive shift in the data, indicating that a much smaller proportion of students who appeared went ungraded in 2083.
- Regular pass percentage rose strongly, from 61.17% in 2082 to 69.75% in 2083, an improvement of 8.58 percentage points. This is the clearest indicator of improved academic outcomes among regular students.
- Partial pass percentage also improved, climbing from 36.49% to 42.38%, a gain of nearly 6 percentage points, though the gap between regular and partial performance remains wide at over 27 points.
- Top GPA brackets grew notably. Students in the 3.61–4.00 range increased by 4,284 (from 13,502 to 17,786), and those in the 3.21–3.60 range added 8,925 students, both strong gains despite fewer total participants.
- The 2.81–3.20 GPA range remained the largest bracket in both years, holding nearly steady at around 94,000 students.
- Lower GPA brackets shrank. The 2.41–2.80 range saw the sharpest drop (-19,215), and the 2.01–2.40 range also declined (-4,656), suggesting an upward shift among mid-range performers into higher GPA bands.
- Canceled exam cases increased slightly from 17 in 2082 to 40 in 2083, though this remains a very small number relative to total participation.
Conclusion
The Grade 12 results for 2083 present a mixed but broadly positive picture. While total graded students declined due to significantly lower overall participation, pass percentages improved meaningfully for both regular and partial students, and the NG count dropped by over 53,000. Growth in the top GPA brackets further signals better performance among those who appeared. With over 1,00,000 students still ungraded and a persistent gap between regular and partial pass rates, focused support for at-risk students remains an important priority for the year ahead.